Customers churn prediction for Sparkify music service
18 minutes to read
04 Aug 2020

Generally, the ability to accurately predict future customer churn rates is necessary for the business. It enables it to secure valuable customers helping anticipate and prevent from churn trends.
Taking action to secure the customer’s time and attention, and bring it back to the product will increase engagement. And once product engagement is increased, the business will lose less customer.
Churn kills businesses; prevention keeps them healthy
The article presents a Customer Churn Prediction Model project done in the context of Udacity Data Science Nanodegree Program.
Business Understanding
We are assuming a hypothetical music streaming service (like spotify) called Sparkify. The users of the service can use either the Premium or the Free Tier subscription. The premium plan with the monthly fees payment enables the use of the service without any advertisements between the songs.
At any point the users can do any of the following:
- Upgrade from the free tier to the Premium subscription
- Downgrade from the Premium subscription to the free tier.
- Drop their account and leave the service

The aim here is to:
- analyse the data,
- extract insights helping to identify churn indicators
- and then build a Machine Learning model helping to identify potential churning customers.
The data analysis, feature engineering and model building was implemented using PySpark. This can be found here.
The value of having a predictive model for customer attrition is mainly in identifying customer churn risk where we don’t already know that a risk exists.
Retaining existing customers circumvents the costs of seeking new and potentially risky customers, and allows organizations to focus more accurately on the needs of the existing customers by building relationships.
Data
The used data contains the user activity events logs happening in the service. Those contain visited pages, service upgrade or downgrade events, demographic information and events timestamps.
Here are the events key attributes
|-- artist: artist name
|-- auth: authentication status
|-- gender
|-- itemInSession: Number of items in the session
|-- length: double (nullable = true)
|-- level: users subscription level
|-- page: svisited page
|-- registration: registration date
|-- ts: levent timestamp
The presented data analysis was performed on a subset of the data (~28K events records). The data timespan is 63 days.
Data Cleaning
8346 Events with empty string as UserId were removed
Data Exploration

Churn indicators
We define churning customers as the users who either downgraded their subscription plan or canceled their account. In other words, a churned customer is one who visited one of the service pages Cancellation Confirmation or Submit Downgrade.
Following the above definition, the service churn rate is equal to 41%
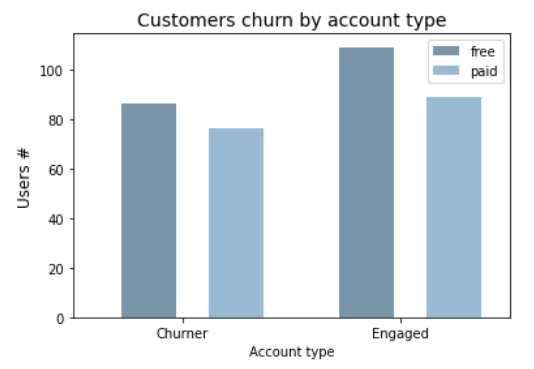
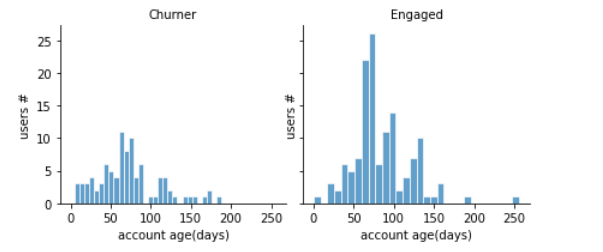
customers registered for a longer period of time are less likely to churn (Loyal/Engaged).
Percentage of the users function of the service usage period
Checking the service usage over the time before the churning event, we observe that around 96% of the users have an account for at least 20 days.
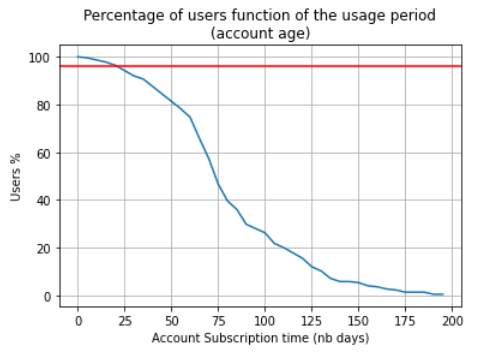
Keeping ~96% of the users (age greater than 20 days) should be sufficient to have a feature reflecting the service usage distribution over the time before churn event (here the last 20 days).
Number of visits per page
Now let’s have a look at the pages visit. We observe that the 82% of the events are for the page NextSong. Then, to be able to clearly visualize the pages visits count we decide to filter out the `NextSong page.
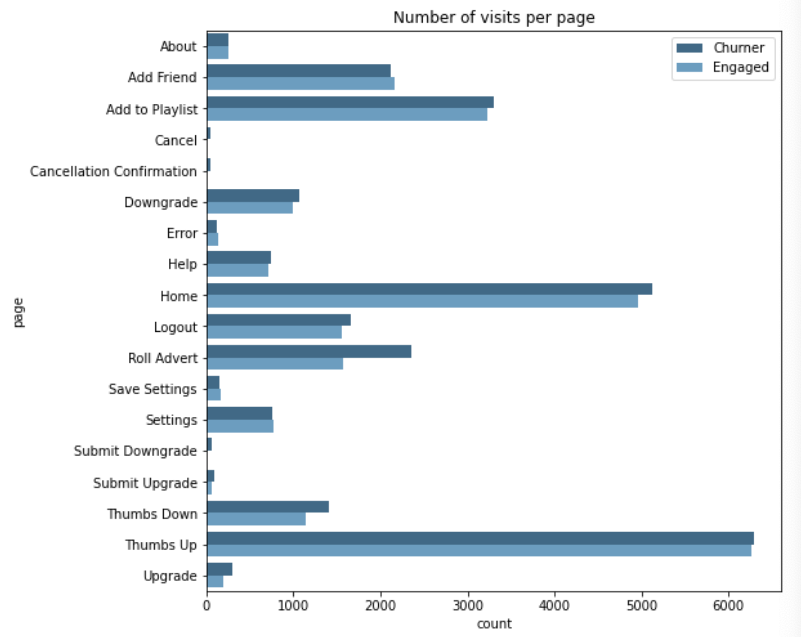
We observe that most of the page visit counts can have an effect on the user engagement e.g ThumbsDown, Roll Advert, NextSong. Let’s see how those pages visits are having a discriminative role to distinguish between Churning and Engaged customers. This either with the customer interactions on the platform or the number of visits to some of the pages like Error page.
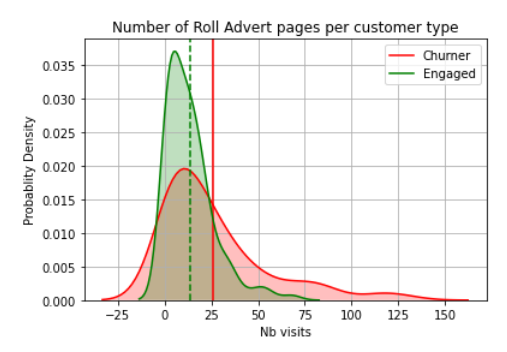
Roll adverts distribution per user type
Engaged users tend to have less Roll Adverts than the Churning users.This might be a good indicator to predict if user is likely to churn if he gets a high number of advertisements.
It appears that on average each of the customers type got the same number of error pages. Let’s check the visits to the Thumbs Up and Down page also the number of sessions per user that could reflect how active is the customer in using the service.
Number of errors distribution per user type
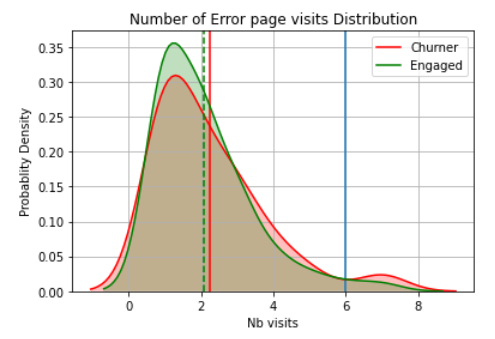 For a number of errors higher than 6, the number of chruning users is higher than the engaged ones. But in average there is no big difference between both users types in term of the number of visited error pages.
Customers interactions on the service platform(ThumbsUp/ThumbsDown)
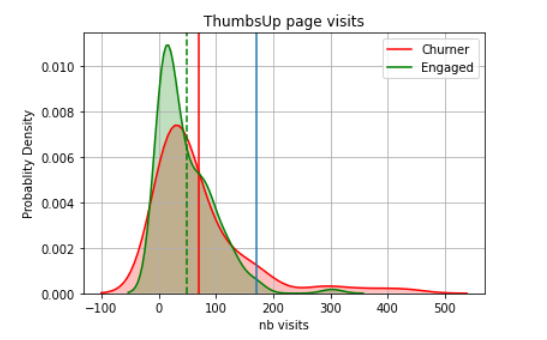
Having a value greater than 200 thumbsUp page visits (combined with other features) might be an indicator for high risk of churn. This is kind of counter intuitive but at the same time this tells us that user that is engaged the most might be the one penalizing the service the most easily.
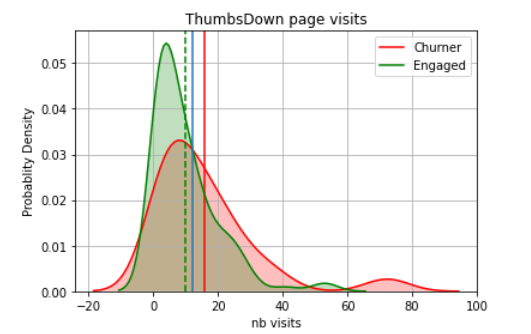
In general, it appears that churning users have less interactions in regard of giving a Thumbs Up or a Thumbs Down to a song. But, we observe that pages distribution is chifted towards a higher number of thumbsDown page visits for churning users . Using the number of thumbsDown pages visit as a feature might help the model to separate the churning users from the engaged ones.
Service usage and customers engagement
In general, if a customer regularly uses the service, there is nothing to worry about. If, on the other hand, the customer’s usage level drops off, there is a need to find out why it dropped and what to do about it.
So let’s measure the service usage and engagement of the users in term of number of songs the users listen to and users sessions.
Average Number of items per session
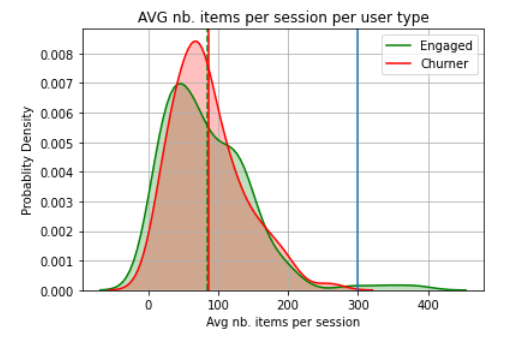
It appears that the average number of items per session doesn’t seem to help on average to distinguish between the churning and engaged users. Around 100 sessions, the engaged users average number of items per session tends to be higher than for the churners. We can also see a clear separation between the churned and engaged users starting from 300 items per session.
Average number of sessions per user
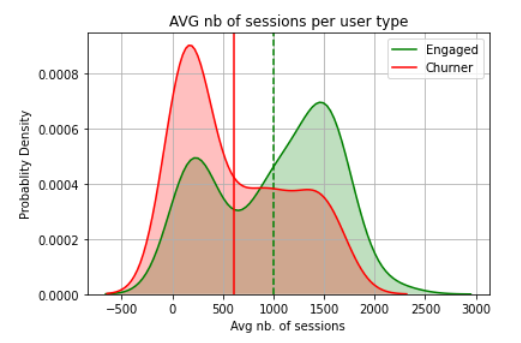
The number of sessions per user tends n average to distinguish between the churned and engaged users. The churners tend to have a lower average number of sessions per day than the engaged users. If leaveraged as a feature this might be automatically picked-up by a tree based model e.g decision tree
Average Service usage over the last 20 days (nbSessions and nbSongs)
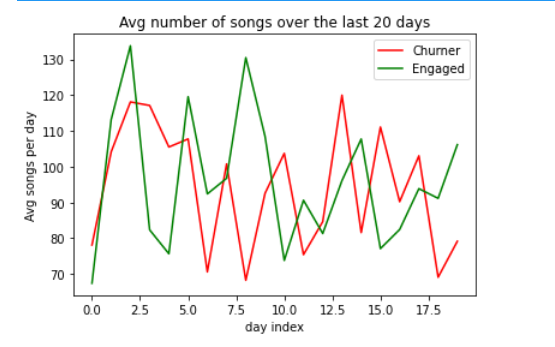 The number of songs for
 churning users is decreasing over the last 20 days of logged events in the service. This might be more discriminant when using more data.
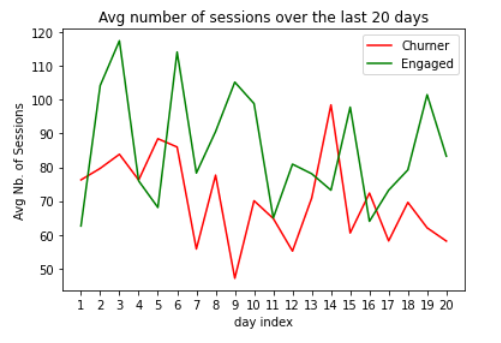
We observe that in average the number of sessions for churning users is higher than for Engaged users.
Features Engineering
In the data exploration step we could extract potential indicators that can be used to distinguish between churning and engaged customers.
We observed that the number of visits to some of the pages could be used as indicators to to know if a customer is likely to churn or not. For example the engaged users were having more interactions on the service platform by visitng more often the ThumbsUp or ThumbsDown pages. Then we decide to use the following features to reflect the pages visits making difference between both types of users:
- Binary feature with value equal to one if the number
ThumbsUppage visits is greater than 20 - Number of
ThumbsDownpage visits - Number of Roll Advert Page visits
We observed that the service usage and level of engagemnt of the customer can be also a clear indicator. Which helped us to define the following features:
- Average daily sessions duration
- Average monthly sessions duration
- Average daily Number of songs per session
- Average daily Number of items per session
- Daily number of songs over the last 20 days (vector of 20 values)
- Daily number of sessions over the last 20 days (vector of 20 values)
The decision in keeping the usage information over only the last 20 days was a result of the check of the percentage of the dataset users that could be kept by number of days the customer have been using sparkify service. See the related analysis and plot in the data exploration part here
One more feature that could help in having an idea about the customer satisfaction in using the service is to know whether the customer can find the artists songs he wants to listen to or not.
- Number of unique artists the user listened to.
We also decided to have some features to characterize the user subscription:
- Last level of the user (Paid or Free)
- User Account age in days: usage duration since first log event day
We finally have a 54-Dimensional features vector to represent that would be used for the model training.
Model training and evaluation
The purpose of our predictive model is to predict which customers are likely to churn and which not. So it is essentially a binary classification problem. The classes are Engaged vs Churned.
Classifying Engaged customers as Churning ones might lead the business to taking actions that might confuse the customer and even make them churning the service. It is also important to correctly classify Churning customers. Then our classifier should be precise in classifying both types of customers.
Model evaluation metrics
Given that churned users are a fairly small subset compared to engaged users, we decided to use F1-Score and AUC metric to evaluate the model performance and select the winning model.
F1-Score : balances the tradeoff between the
precisionandrecallmetrics, which is useful in our binary classification problem with the actual classes scale.
The area under the ROC curve (AUC) : Its advantage over the accuracy is that it is
insensitive to imbalanced classes. It doesn’t place more emphasis on one class over the other by assessing the overall classification performance by measuring how well predictions are ranked, rather than their absolute values.
Trained Models and evaluation
We tried out various models starting from the simplest one Logistic Regression to the more complex ones(Random Forest, Gradient-Boosted Trees). We scaled the data to train to avoid that the Logisitc Regression model performs poorly when features differ widely in scale.
The model were then compared in term of F1-Score and AUC.
In order to have a less biased estimate of the model performance on unseen data we leveraged k-Fold Cross-Validation(k=3) from Spark Python API CrossValidator.
To use the same dataset for the various models algorithms, we performed data scaling using StandardScaler. That Standardizes features by normalizing each feature to have unit standard deviation and/or zero mean.
Tree-based algorithms are not sensitive to the scale of the features but we need that for the Logistic Regression Classifier.
Hyperparameters Tuning
To find the optimal hyperparameters of each of the tried models , we leveraged Grid Search. We then used the AUC metric to select the best model parameters and retrain the model on the training dataset (without the K-Fold data sampling).
Here are the parameters used for the models:
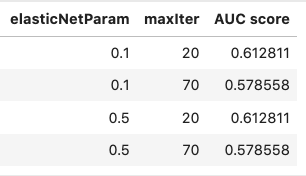
- elasticNetParam ElasticNet mixing parameter. In in range [0, 1]. 0 for L2 penalty and 1 for an L1 penalty, default=0.0: [0.1, 0.5]
- maxIter Maximum number of iterations: [20, 70]
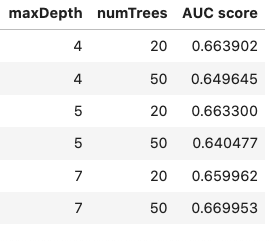
- maxDepth maximum tree depth, default=5: [4, 5, 7]
- numTrees Number of Trees, default=20: [20, 50]
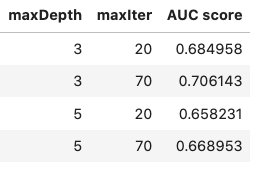
- maxDepth Maximum Tree Depth, default=5: [5, 7]
- maxIter Maximum number of iterations, default=20: [70, 100]
Trained Models Evaluation
After the hyperparameter tuning the models were re-trained with the the best performing parameters and evaluated using the F1 Score and AUC metric.
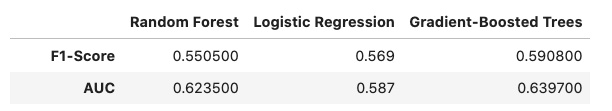
Gradient Boosted Tree turned to be the winning model predicting how likely is a user to churn.
We have to emphasize that the results correspond to models that were trained and tested using a small data-set. The data-set sample contains 286500 events logs for only 225 unique users.
Conclusion
Let’s take a step back and look at the whole journey.
We wanted to predict customers churn for a hypothetical music streaming service. That using Apache Spark in all the Machine Learning workflow steps. For that we needed to have a binary classifier for the Churner and Engaged customers.
I started by performing the data cleaning to remove log events without a user Id and checked the missing vakues in the dataset. I then did multiple data explorations to see how various indicators can help in distinguishing between Churned and Engaged customers. I defined the customer churn indicator based on wether the user visited the any of the pages Cancellation Confirmation and Downgrade Submission or not. Next in the features engineering step I extracted categorical and numerical features. For that I used the observed indicators during the data exploration. I also explored the last 20 days of service usage to represent the behaviour of the user before the churn event based on the number of sessions and the number of songs each day.
We split the data into training and validation data sets. And as a final step I performed model training by trying out various models varying from simple to complex ones: Logistic Regression, Random Forest and Gradient-Boosted Trees. I leveraged cross validation and grid search to fine tune the different models. Their performance got compared using the AUC metric.
Gradient-Boosted Trees turned to be the winning model. We achieved about 0.64 AUC, and 0.59 F1 Score. Potentially with the whole dataset, the data exploration observation and features engineering will be more informative and stable. The model might also be enhanced.
Potential Improvements
We Could try other models algorithms. But before that we would like to do more substantial data exploration and features engineering to have a more accurate model in detecting whether a user is likely to churn or not. For that we would:
- Add more temporal features reflecting the service usage over the last N days.
- Optimize the data analysis and feature engineering steps applying more Spark best practices for having efficient data exploration as well as model training and testing processes.
- Perform data exploration on bigger batches of data subsets before using the big dataset due to the substential statistical differences with the big dataset.
- With a higher computations power, performing a better Hyperparameter tuning for other model algorithms on Spark Cluster.
The project code can be found here.